Market Mover - Economic Dashboard
Submitted by TLWM Financial on February 28th, 2017As the market continues to reach new highs it's not surprising to see investors begin to worry as the mindset seems to be- what goes up must come down. We are strong believers in making changes within a portfolio if we feel that it's likely a recession is on the horizon. In order to make that type of forecast we need to have our finger on the pulse of the economy. To do this we monitor a number of data points through our economic dashboard. Around this time last year, a few of our indicators were beginning to show cause for possible concern. Fast forward to this year and the dashboard has improved and, in our opinion, signals a low chance of recession over the next 6 to 12 months. Here we'll review the improvement we have seen in the dashboard:
Market Breadth: Market breadth can be used as a technical indicator to see what proportion of stocks are participating in the market move. The higher the number of stocks participating the wider the breadth, and therefore strength is seen. According to LPL Financial, the NYSE Composite Index made new highs last month which made it the last of the big six US indices to reach all time highs. As stated by LPL, "when all six of these indices trend in the same direction market breadth for U.S. stocks is strong."
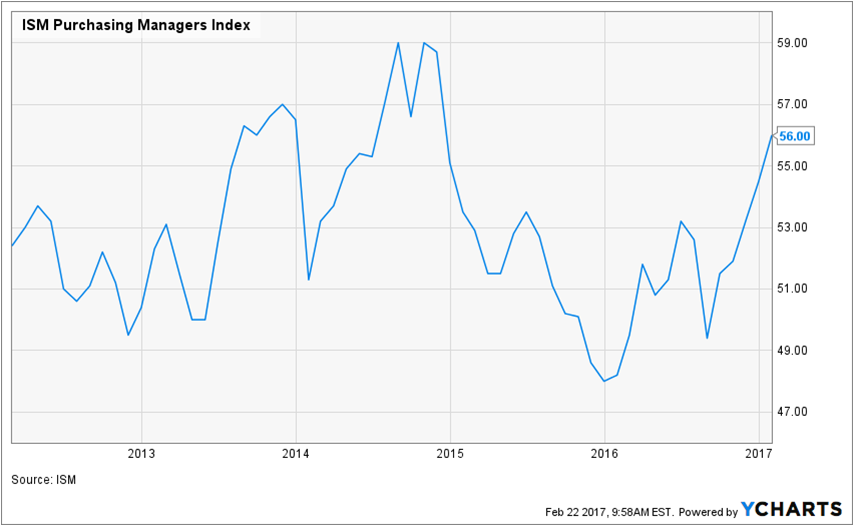
Purchasing Managers Index (PMI): This is a measure of manufacturing activity and historically has been a good predictor of earnings growth over the next 6 months or so. Historically, if the PMI Index is rising we might expect earnings to rise over the next 6 months, while if it is declining we could potentially see weakness in earnings over the next 6 months. A reading above 50 is viewed as expansionary and the index is currently reading 56 compared with 48.20 a year ago. This sustained move has us optimistic about what the future may hold for the US economy.

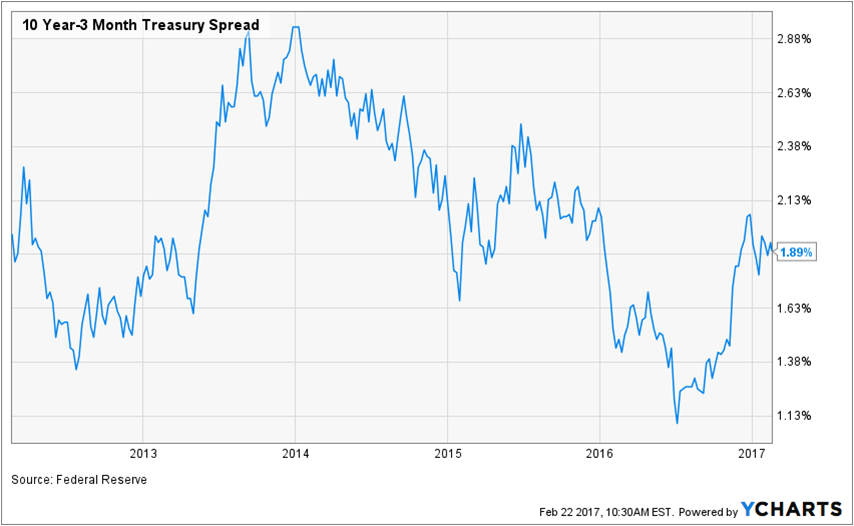
The Yield Spread: This indicator shows the difference in yield between the 10 year Treasury and the 3 month Treasury Bill. It has historically signaled a recession over the next 12 months once the yield curve inverts (the 10 year yields less than the 3 month). We often see this when short-term rates move higher than long-term rates, which in many cases has occurred during times of tightening monetary policy. In the past 6 months the yield curve has steepened as longer-term rates have risen potentially showing signs of renewed economic growth and an inflationary environment. As such, there appears little chance of a yield curve inversion in the near future.

One indicator that we are still cautious about is valuation, as forward PEs are still above their long-term average. While the absolute level of valuations (how expensive the market appears) could cause concern we believe the low interest rate environment, and strong earnings outlook potentially justifies stocks being a little more expensive. According to Argus, “Stocks are trading at 17.5-times our 2017 estimate, an above-average multiple that we believe is justified by historically low yields, rebounding corporate earnings and, for the first time in many years, the potential for fiscal stimulus in the form of infrastructure spending and more favorable tax rates.”
The improvement seen in our economic indicators make us believe the chances for a recession over the next 6- 12 months is low which could present us with an environment in which stocks move higher. However, as always we will continue to monitor our economic dashboard closely and be ready to make any changes as needed.
Investing involves risk including loss of principal.
The opinions voiced in this material are for general information only and are not intended to provide or be construed as providing specific investment advice or recommendations for any individual.
To determine which investments may be appropriate for you, consult your financial advisor prior to investing.
All indices are unmanaged and cannot be invested into directly.
* The Standard & Poor's 500 (S&P 500) is an unmanaged group of securities considered to be representative of the stock market in general. You cannot invest directly in this index.
* The Standard & Poor’s 500 (S&P 500) is an unmanaged index. Unmanaged index returns do not reflect fees, expenses, or sales charges. Index performance is not indicative of the performance of any investment.
* Opinions expressed are subject to change without notice and are not intended as investment advice or to predict future performance.
* Economic forecasts set forth may not develop as predicted and there can be no guarantee that strategies promoted will be successful.
* Past performance does not guarantee future results. Investing involves risk, including loss of principal.
* Stock investing involves risk including loss of principal.
* The price-earnings ratio (P/E Ratio) is the ratio for valuing a company that measures its current share price relative to its per-share earnings.

