

MARKET UPDATE: TLWM ECONOMIC DASHBOARD SHOWS IMPROVEMENTS
Submitted by TLWM Financial on April 14th, 2016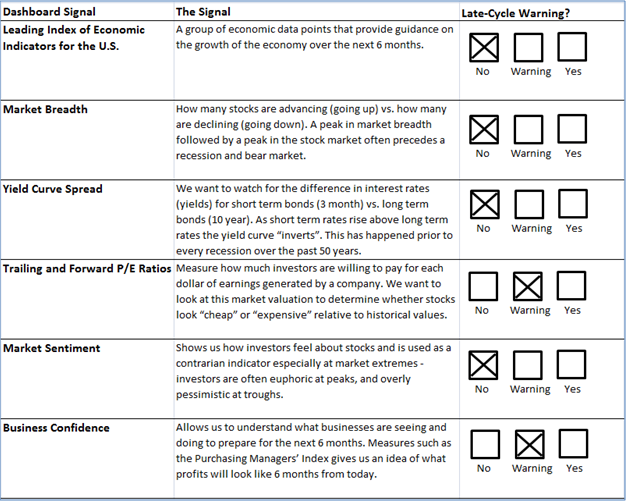
The first quarter of 2016 brought with it substantial volatility in the equity markets as we entered the year with fairly negative investor sentiment and deteriorating economic conditions. The deterioration in US economic data led us to update our dashboard and become slightly more cautious and we saw 3 of our 6 indicators give us reason for caution. The declining economic outlook was seen through downgrades to two of the indicators on our dashboard, business confidence and market breadth. We changed business confidence (a measurement of manufacturing activity) to red, while we modified market breadth (technical measurement of market strength) to yellow. As we review our dashboard indicators at the end of the first quarter we've seen fundamental data in the US improve; warranting only 2 of our 6 indicators now giving us a warning sign.
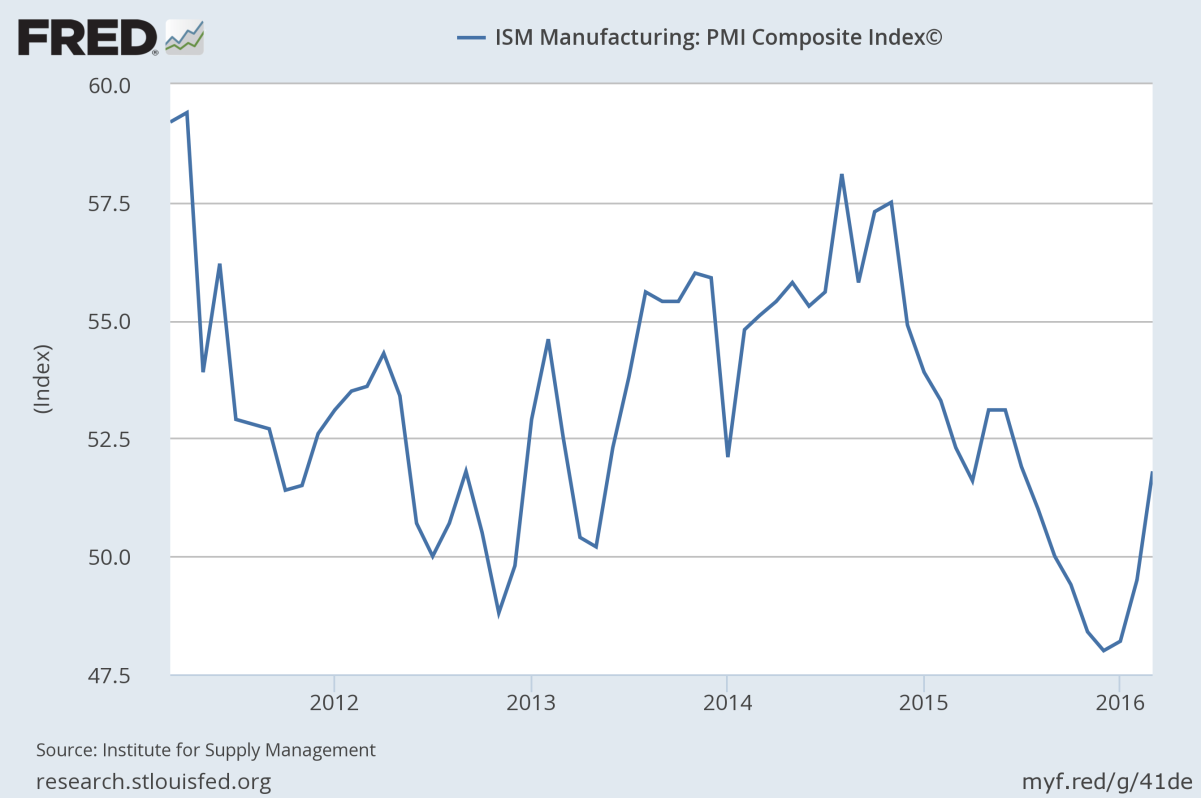
The purchasing managers index, PMI, fell below 50 to 48.6 for November, 2015. This was the first reading under 50 since 2012, when it dipped below 50 for one month. 50 is a key number for PMI data as above 50 indicates expansion in manufacturing while below 50 shows contraction. While a one-month change could just be noise, (as it was in 2012) the December data brought a drop further below 50 and was the 6th consecutive month of worsening data. At that time we moved our indicator to red. Investors feared weakness in oil had further spread into the manufacturing sector and many asked the question 'would it spread into other areas of the economy?' Since then those fears have subsided as subsequent readings have improved. The March reading broke back above 50, coming in at 51.8 and was the 3rd consecutive month of improvement. With this improvement behind us we believe it is time to move the PMI indicator on our dashboard back to yellow or warning. While we recognize there are improvements in the manufacturing sector we are still cautious and will continue to closely monitor developments.
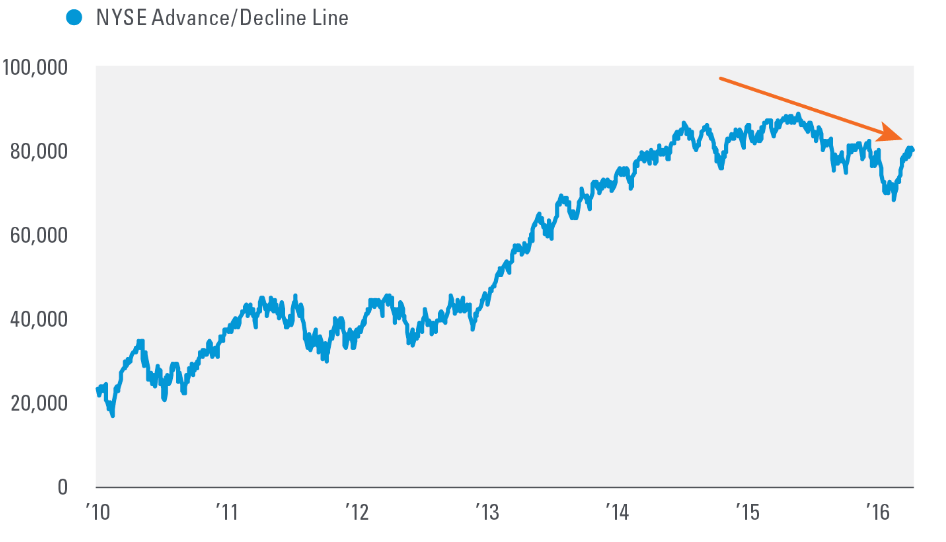
The other indicator that gave us cause for concern was market breadth, but now we are also starting to see improvement in this indicator. Market breadth allows us to take a look at the strength of the market by looking at how many stocks are rising, and how many are falling. Currently, 58% of stocks on the NYSE are trading above their 200 day moving average according to finviz, in-line with the long-term average. This signals an improvement in the participation of stocks during the recent rally as we are seeing more stocks advance than decline. The broader the participation the more underlying strength is seen in the market. Recently, we have seen a measure of market breadth (the NYSE cumulative advance/decline line) break above a trend line that goes back nearly 10 months. This improvement and underlying strength gives reason to move this indicator away from warning and back to green.
Source: LPL Research, Bloomberg 4/4/16
Investing involves risk including loss of principal. The opinions voiced in this material are for general information only and are not intended to provide or be construed as providing specific investment advice or recommendations for any individual. To determine which investments may be appropriate for you, consult your financial advisor prior to investing. All indicies are unmanaged and cannot be invested into directly.