

Weekly Market Commentary
Submitted by TLWM Financial on April 17th, 2018
The Markets
What do you think?
• Are you bullish, bearish, or neutral about the U.S. stock market?
• Are U.S. stocks undervalued, overvalued, or fairly valued?
• What is the biggest threat the U.S. stock market faces this year?
During the first four months of 2018, U.S. stocks have experienced not one, but two, 10 percent declines. These short-term reversals are known as corrections. They occur relatively often, helping to wring out investor exuberance and, sometimes, to create buying opportunities as share prices drop.
The current twinset of corrections appears to have created a fair amount of uncertainty, according to Barron’s bi-annual Big Money Poll of professional investors. The ranks of the bullish have diminished, and the bearish remain relatively unchanged, but the number of those who are ‘neutral’ has swelled:
Fall 2017 Spring 2018
Bullish 61 percent 55 percent
Bearish 12 percent 11 percent
Neutral 27 percent 34 percent
Professional investors say their clients are also unsure about stock markets. They indicated 60 percent of clients were neutral about stocks, while 23 percent were bullish and 17 percent were bearish.
When asked about market valuations, a majority thought U.S. stocks were fairly valued (57 percent) after the corrections. Thirty-five percent believe stocks remain overvalued, and 8 percent believe stocks have become undervalued.
If either ‘political/policy missteps’ or ‘rising interest rates’ was your answer to the biggest threat to U.S. stocks, then you’re thinking like a professional investor. Their list of worries included:
Political/policy missteps 35 percent
Rising interest rates 32 percent
Earnings disappointments 7 percent
Geopolitical crises 7 percent
Last week, the Dow Jones Industrial Average gained 1.8 percent, the Standard & Poor’s 500 Index was up 2.0 percent, and the NASDAQ Composite rose 2.8 percent.
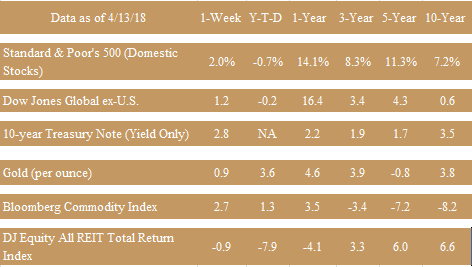
S&P 500, Dow Jones Global ex-US, Gold, Bloomberg Commodity Index returns exclude reinvested dividends (gold does not pay a dividend) and the three-, five-, and 10-year returns are annualized; the DJ Equity All REIT Total Return Index does include reinvested dividends and the three-, five-, and 10-year returns are annualized; and the 10-year Treasury Note is simply the yield at the close of the day on each of the historical time periods.
Sources: Yahoo! Finance, Barron’s, djindexes.com, London Bullion Market Association.
Past performance is no guarantee of future results. Indices are unmanaged and cannot be invested into directly. N/A means not applicable.
WHAT DOES YOUR PLAYLIST SAY ABOUT YOU? Your preference for pop, country, opera, classic rock, or some other type of music may provide clues to your personality, according to an article in Psychological Science entitled ‘Musical Preferences Predict Personality.’
Psychologists have been studying ‘personality’ for a long time. Their goal is to understand why people think, feel, and behave differently in the same situation. The prevailing personality model is called the ‘Big Five.’ It holds there are five factors that describe a broad range of personality traits and characteristics. No single factor describes personality by itself:
• Extroversion includes people on two ends of a spectrum, introverts and extroverts. Extroverts thrive on interactions with others while introverts thrive on solitude. This factor reflects a person’s tendency to be sociable, assertive, talkative, and friendly.
• Agreeableness describes how well people get along well with others. This factor encompasses altruism, trust, tact, and loyalty.
• Conscientiousness describes how well people control their impulses and act in socially acceptable ways. It encompasses persistence, ambition, energy, and resourcefulness.
• Neuroticism describes how comfortable and confident people are with themselves. It encompasses awkwardness, pessimism, insecurity, and wariness.
• Openness to experience describes willingness to try new experiences and think outside the box. This factor reflects perceptiveness, curiosity, insightfulness, and imagination.
As it turns out, musical preferences are pretty good predictors of some personality factors, especially openness, extroversion, and agreeableness. Openness is associated with a preference for ‘sophisticated’ music (classical, operatic, world, and jazz), extroversion is associated with ‘unpretentious’ music (country and folk), and, as you might expect, agreeableness is associated with liking all types of music.
It’s notable that musical preferences fail to predict conscientiousness.
Weekly Focus – Think About It
“Sometimes they would take two ropes and turn them as a single rope together, but you could separate them and turn them in like an eggbeater on each other. The skipping rope was like a steady timeline – tick, tick, tick, tick – upon which you can add rhymes and rhythms and chants. Those ropes created a space where we were able to contribute to something that was far greater than the neighborhood.”
--Kyra Gaunt, Professor, Songwriter, Performer
Best regards,
Enzo T. Pellegrino, CFP®
President & Wealth Advisor
P.S. Please feel free to forward this commentary to family, friends, or colleagues. If you would like us to add them to the list, please reply to this email with their email address and we will ask for their permission to be added.
Securities offered through LPL Financial, Member FINRA/SIPC.
* These views are those of Carson Group Coaching, and not the presenting Representative or the Representative’s Broker/Dealer, and should not be construed as investment advice.
* This newsletter was prepared by Carson Group Coaching. Carson Group Coaching is not affiliated with the named broker/dealer.
* Government bonds and Treasury Bills are guaranteed by the U.S. government as to the timely payment of principal and interest and, if held to maturity, offer a fixed rate of return and fixed principal value. However, the value of fund shares is not guaranteed and will fluctuate.
* Corporate bonds are considered higher risk than government bonds but normally offer a higher yield and are subject to market, interest rate and credit risk as well as additional risks based on the quality of issuer coupon rate, price, yield, maturity, and redemption features.
* The Standard & Poor's 500 (S&P 500) is an unmanaged group of securities considered to be representative of the stock market in general. You cannot invest directly in this index.
* All indexes referenced are unmanaged. Unmanaged index returns do not reflect fees, expenses, or sales charges. Index performance is not indicative of the performance of any investment.
* The Dow Jones Global ex-U.S. Index covers approximately 95% of the market capitalization of the 45 developed and emerging countries included in the Index.
* The 10-year Treasury Note represents debt owed by the United States Treasury to the public. Since the U.S. Government is seen as a risk-free borrower, investors use the 10-year Treasury Note as a benchmark for the long-term bond market.
* Gold represents the afternoon gold price as reported by the London Bullion Market Association. The gold price is set twice daily by the London Gold Fixing Company at 10:30 and 15:00 and is expressed in U.S. dollars per fine troy ounce.
* The Bloomberg Commodity Index is designed to be a highly liquid and diversified benchmark for the commodity futures market. The Index is composed of futures contracts on 19 physical commodities and was launched on July 14, 1998.
* The DJ Equity All REIT Total Return Index measures the total return performance of the equity subcategory of the Real Estate Investment Trust (REIT) industry as calculated by Dow Jones.
* Yahoo! Finance is the source for any reference to the performance of an index between two specific periods.
* Opinions expressed are subject to change without notice and are not intended as investment advice or to predict future performance.
* Economic forecasts set forth may not develop as predicted and there can be no guarantee that strategies promoted will be successful.
* Past performance does not guarantee future results. Investing involves risk, including loss of principal.
* You cannot invest directly in an index.
* Stock investing involves risk including loss of principal.
* Consult your financial professional before making any investment decision.